
Ecology
Ecology describes how discovered patterns distribute across parameter and behavior space. LeniaCLI analyze ecology exports the table this analysis runs on.
Terms
parameter space: the coordinate system induced by genotype parameters.niche: a dense region of parameter-behavior occupancy.habitat: practical synonym here for a region where similar behaviors persist.edge of chaos: the hypothesis that rich, diverse dynamics cluster near transition regions. This is a framing idea; the dossier has not tested it.
The ecology export
LeniaCLI analyze ecology exports a deterministic parameter-space dataset from compendium.sqlite for analysis and plotting. It assigns no labels; it passes through whatever taxonomy and metrics the compendium holds.
Required:
--db(--db-path): compendium SQLite path.
Optional:
--output(defaultoutputs/ecology): artifact directory.--include-unstable: include unstable creatures.--limit <n>: cap exported rows.--plot: write amu-sigmascatter PNG.--plot-width,--plot-height: plot dimensions.--pca: compute PCA(2) on genotype vectors.--pca-max-rows: cap rows used for PCA.
The command fails if:
compendium_metaorcreaturesis missing,- the schema version differs from the current
compendiumSchemaVersion, creaturesis empty,- PCA is requested with fewer than 2 usable rows,
- genotype vectors are inconsistent in length.
Output files are date-prefixed (YYYY-MM-DD):
<date>-ecology-embedding.jsonl: one row per creature.<date>-ecology-summary.json: export metadata and output file paths.<date>-ecology-pca2.jsonl(with--pca): PCA coordinates.<date>-ecology-mu-sigma.png(with--plot): scatter plot.
Each embedding row contains:
- identity:
id,runId,isStable,score. - taxonomy passthrough:
taxonomyFamilyId,taxonomyGenusId,taxonomySpeciesId. These arenulluntilLeniaCLI analyze taxonomyhas run on the compendium (see Taxonomy). - genotype summaries:
kernelCount,muSigma([mean(m), mean(s)]),betaSummary(rMean,bMean,bMax,wMean,wMax,aMean,aMax,R),genotypeVector(canonicalized flattened kernel vector plusR).
- metrics subset:
massMean,gyration,centerVelocity,complexityMean.
The plot is deliberately simple and deterministic: a histogram density overlay plus points, with no KDE dependency.
The quality-gated corpus (2026-02-28)
A snapshot of the canonical artifacts/compendium.sqlite taken on 2026-02-28, at schema version 4:
- indexed runs:
7 - total indexed creatures:
224 - stable creatures:
224 - unique genotypes:
224(unique/rows ratio1.0000) - taxonomy-assigned rows:
0, because the taxonomy command did not exist yet
Mu-sigma occupancy from that corpus (LeniaCLI analyze ecology --plot):
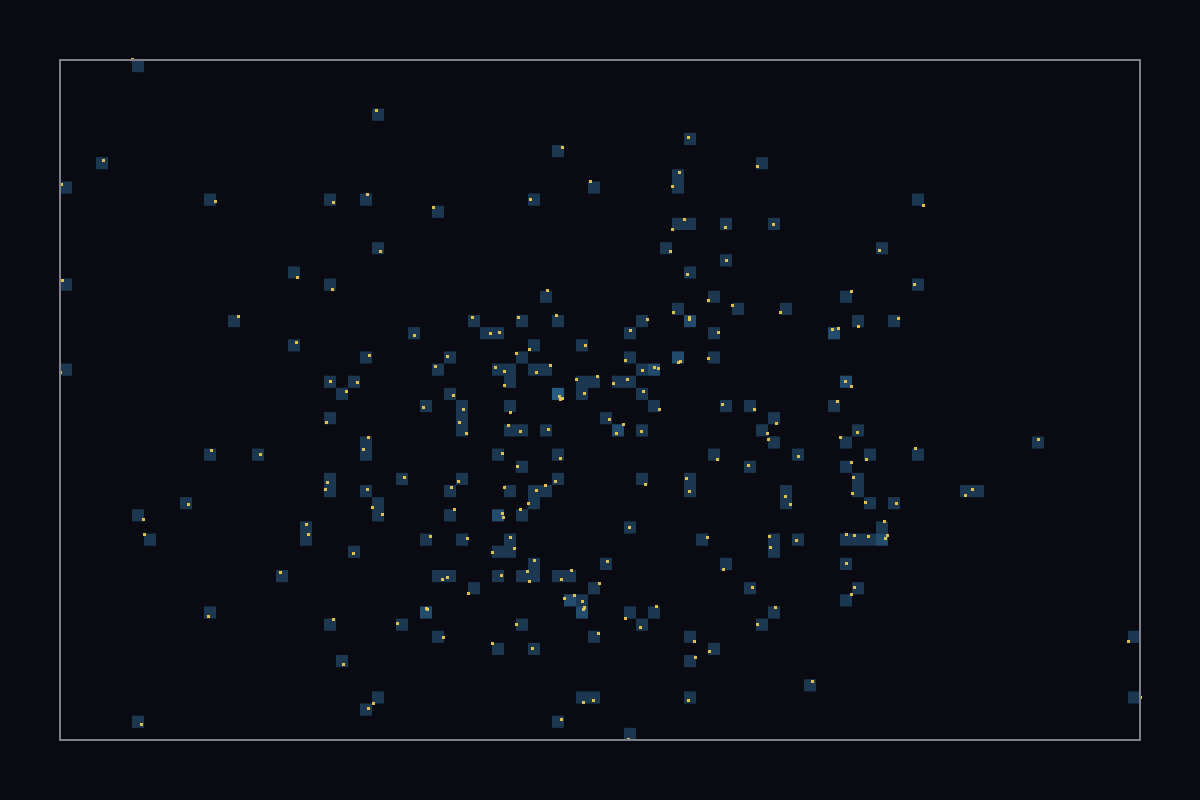
Each point is one indexed creature projected to:
mu: mean kernel center value (m) across kernels,sigma: mean kernel width value (s) across kernels.
Slow, meandering exemplar frame:
The corpus has strong diversity within its regime (non-overlapping seed blocks, no duplicated genotypes), but it is a single-regime sample from NNEA-style search only. It supports fitting thresholds on a clean population, testing the export and PCA wiring, and grounding terminology with stable examples. It does not support multi-habitat niche mapping or claims about ecological bands across regimes, and its snapshot predates taxonomy.
Not implemented
- automated niche labeling and naming,
- ecological maps grouped by taxonomy,
- causal tests for “edge of chaos” claims.